

Image Details
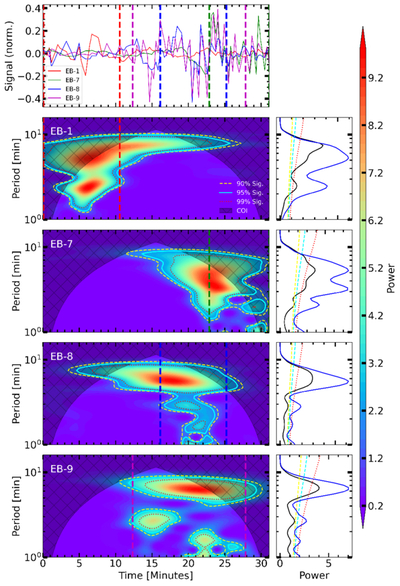
Caption: Figure 9.
Wavelet analysis of the average intensity variations of the Hβ spectral line over the wavelength range −0.71 to −0.44 Å for four EB events (labeled 1, 7, 8, and 9 in the upper panel of Figure 1). The vertical dashed magenta lines indicate the lifetimes of the EBs, while the contours denote different significance levels. In the right panels, the black curves show the global wavelet power spectra, and the blue curves represent the power spectra averaged over the EB lifetimes only.
Other Images in This Article
Show More
Copyright and Terms & Conditions
© 2026. The Author(s). Published by the American Astronomical Society.

Copyright ©
2026 Astronomy Image Explorer. All Rights Reserved.
