

Image Details
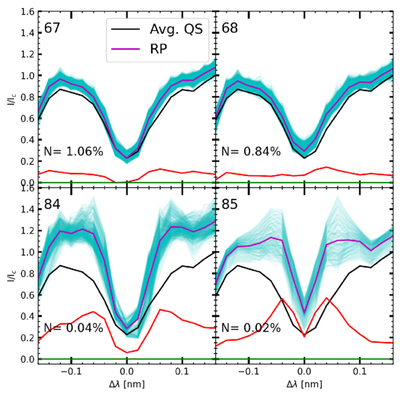
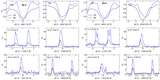
Caption: Figure 2.
Four of the 85 representative profiles (RPs) identified via k-means clustering of an Hβ line-scan dataset. Magenta curves in the upper panels (RPs 67 and 68) show cluster centers of MCs, while those in the lower panels (RPs 84 and 85) correspond to EBs. Cyan shading marks all profiles in each cluster. Red curves show the difference between the cluster center and the average profile (black), with the green line indicating zero normalized intensity. N denotes the percentage of total profiles in each cluster.
Other Images in This Article
Show More
Copyright and Terms & Conditions
© 2026. The Author(s). Published by the American Astronomical Society.

Copyright ©
2026 Astronomy Image Explorer. All Rights Reserved.
