

Image Details
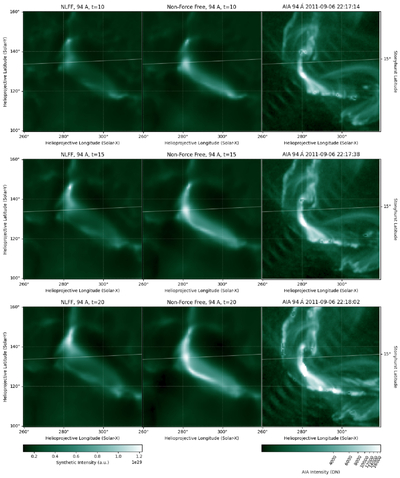
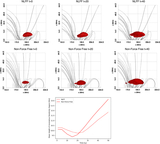
Caption: Figure 6.
A comparison of the synthetic and measured 94 Å emission. In the left and central columns, synthetic emission is shown from the NLFF and non-force-free initialized simulations, respectively. The top row shows the simulations at t = 10tA, the middle row at t = 15tA, and the bottom row at t = 20tA. The synthetic emission is scaled to the brightest emission of the six panels (at t = 20tA in the non-force-free simulation), indicated by the lower-left color bar. The right column shows the measured AIA 94 Å emission, with the top, middle, and bottom panels taken at 22:17:14, 22:17:38, and 22:18:02 UT, respectively. Each measured intensity image is scaled to the brightest intensity in the latest unsaturated image, indicated by the color bar in the lower right. An animation of this figure is available in the online version of the article. The animation contains three sections: (1) the synthetic emission from the NLFF simulation from t = 0 to 100tA; (2) the synthetic emission from the non-force-free simulation from t = 0 to 100tA; (3) the measured AIA 94 Å emission from 22:14:01 to 22:20:02 UT.
(An animation of this figure is available in the online article.)
(An animation of this figure is available.)
The video/animation of this figure is available in the online journal.
Other Images in This Article
Copyright and Terms & Conditions
© 2026. The Author(s). Published by the American Astronomical Society.

