

Image Details
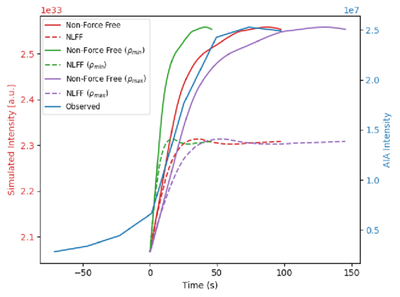
Caption: Figure 7.
The green, red, and purple lines show the synthetic 94 Å light curves for both of the simulations, with density scaling factors corresponding to density at the upper domain boundary of ρt = 2 × 10⁸, 9 × 10⁸, and 1010 cm−3, respectively. The solid lines corresponds to the non-force-free case, and the dashed lines to the NLFF case. The blue line shows the measured AIA 94 Å light curve.
Other Images in This Article
Copyright and Terms & Conditions
© 2026. The Author(s). Published by the American Astronomical Society.

Copyright ©
2026 Astronomy Image Explorer. All Rights Reserved.
