

Image Details
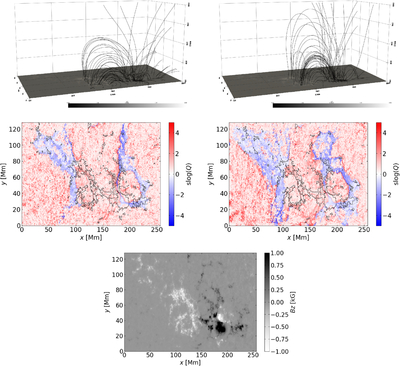
Caption: Figure 1.
In the left column, the NLFF extrapolation is shown, and in the right, the non-force-free one. The magnetic field lines shown are seeded at the same locations in both, with the field line density proportional to magnetic field strength at the lower boundary. The lower surface in the top row is colored according to Bz at the lower boundary. The second row shows the value of slogQ calculated at the lower boundary for the NLFF and non-force-free field extrapolations. Blue corresponds to open field lines and red to closed lines. The black contour shows an absolute value of vertical magnetic field of 0.2 kG. The lower panel shows the vertical magnetic field at the lower boundary, the initial surface magnetogram of AR11283, taken on 2011 September 6 at 20:48 UTC from SDO/HMI. This has been saturated at ±1 kG for ease of comparison.
Other Images in This Article
Copyright and Terms & Conditions
© 2026. The Author(s). Published by the American Astronomical Society.

