

Image Details
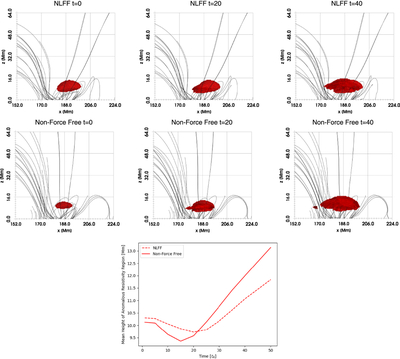
Caption: Figure 4.
In the top row, results of the simulation initialized with the NLFF extrapolation are shown, and in the middle row, the non-force-free one. The left column shows the initial configuration, while the next two columns show the simulation at t = 20, 40 tA. The magnetic field lines shown are seeded at the same locations in both, with the field line density proportional to magnetic field strength at the lower boundary. The red volume corresponds to the location where anomalous resistivity is active during that stage of the simulation. The bottom panel shows the mean height of the anomalous resistivity region in both simulations over time, with the NLFF and non-force-free models being represented by the dashed and solid lines, respectively.
Other Images in This Article
Copyright and Terms & Conditions
© 2026. The Author(s). Published by the American Astronomical Society.

