

Image Details
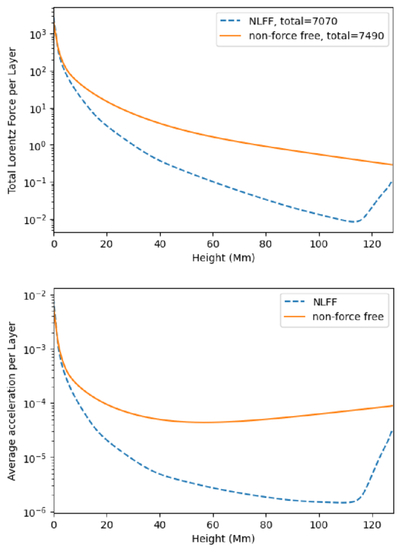
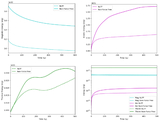
Caption: Figure 2.
In the first panel, the Lorentz force summed in each layer of the extrapolations is shown on a log-scale as a function of height. The solid line represents the NLFF model, and the dashed line represents the non-force-free model. In the second panel, this is recast as average acceleration per layer using force and density. Both dependent variables are presented in normalized units.
Other Images in This Article
Copyright and Terms & Conditions
© 2026. The Author(s). Published by the American Astronomical Society.

Copyright ©
2026 Astronomy Image Explorer. All Rights Reserved.
