

Image Details
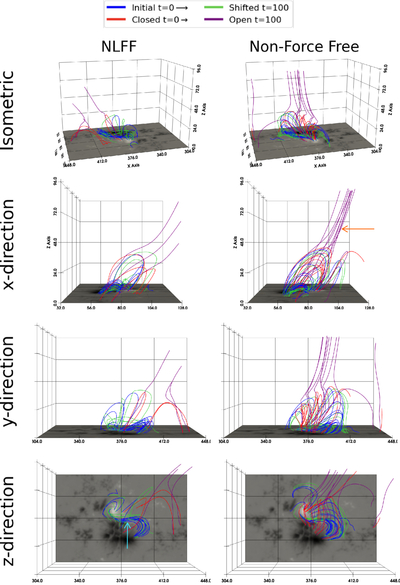
Caption: Figure 3.
Magnetic field restructuring in the two simulations. The left column shows the NLFF case, and the right column shows the non-force-free case. All panels correspond to the same times, with field line connectivity compared between t = 0 and t = 100tA. The rows show different viewing angles: isometric and projections along the x-, y-, and z-axes. Red field lines indicate structures that are initially closed at t = 0, while the corresponding purple lines show their connectivity at t = 100tA, highlighting field lines that become open. Blue field lines denote structures at t = 0 whose footpoints undergo significant displacement (>5 Mm), with their later positions shown in green at t = 100tA.
Other Images in This Article
Copyright and Terms & Conditions
© 2026. The Author(s). Published by the American Astronomical Society.

