

Image Details
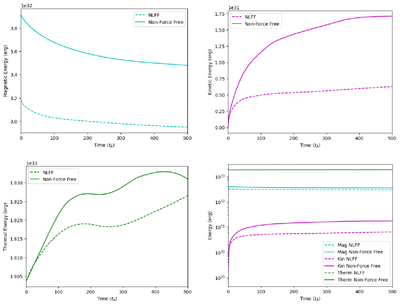
Caption: Figure 5.
Energy over time for both the NLFF (dashed lines) and non-force-free (solid lines) simulations. The first plot (cyan) shows magnetic energy, the second (purple) shows kinetic energy, the third (green) shows thermal energy, and the fourth shows all of them together with a log-scale for comparison.
Other Images in This Article
Copyright and Terms & Conditions
© 2026. The Author(s). Published by the American Astronomical Society.

Copyright ©
2026 Astronomy Image Explorer. All Rights Reserved.
