

Image Details
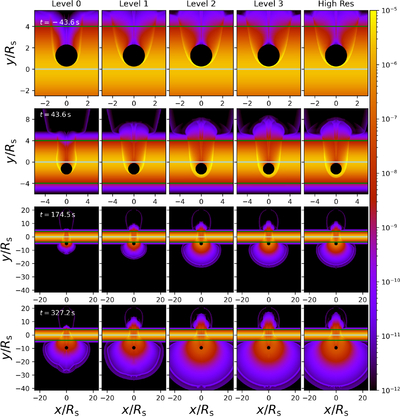
Caption: Figure 5.
Density snapshots for the star–disk collision with different resolutions and SMR levels. Each column represents a different configuration: the first four columns correspond to a resolution of 1024 × 1600 with SMR levels 0, 1, 2, and 3, respectively, while the fifth column shows results at a uniform resolution of 4096 × 6400. Note that the effective highest resolution of the third column (1024 × 1600 with SMR level 2) around the star is equivalent to the resolution of the fifth column. Rows represent the simulation time at frames −43.6 s, 43.6 s, 174.5 s, and 327.2 s, from top to bottom. The gray horizontal lines represent the disk’s midplane, and the green lines represent 4Hd from the midplane.
Other Images in This Article
Show More
Copyright and Terms & Conditions
© 2026. The Author(s). Published by the American Astronomical Society.

