

Image Details
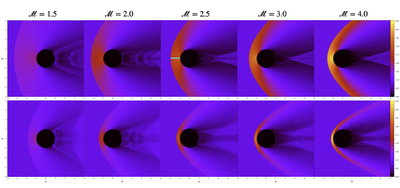
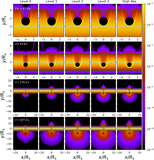
Caption: Figure 2.
Density snapshots of a solid body in a uniform supersonic flow with different ﹩{ \mathcal M }﹩. From left to right, each column represents ﹩{ \mathcal M }=1.5﹩, 2.0, 2.5, 3.0, and 4.0, respectively. The top row shows results from 2D simulations, and the bottom row shows the midplane (z = 0) of 3D simulations. The cyan line in the third panel of the first row represents the shock stand-off distance. The adiabatic index is γ = 1.4 for these plots.
Other Images in This Article
Show More
Copyright and Terms & Conditions
© 2026. The Author(s). Published by the American Astronomical Society.

Copyright ©
2026 Astronomy Image Explorer. All Rights Reserved.
