

Image Details
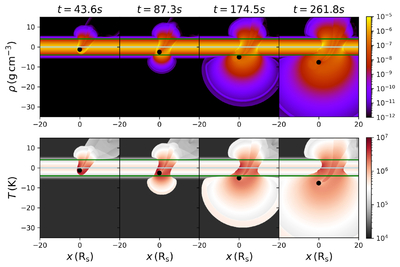
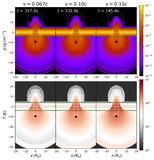
Caption: Figure 8.
Density and temperature snapshots from run08, where the star impacts the disk at an inclination angle of 45°. The top and bottom rows show density and temperature, respectively. From left to right, each column corresponds to t = 43.6 s, 87.3 s, 174.5 s, and 261.8 s. The gray horizontal lines represent the disk’s midplane, and the green lines represent 4Hd from the midplane.
Other Images in This Article
Show More
Copyright and Terms & Conditions
© 2026. The Author(s). Published by the American Astronomical Society.

Copyright ©
2026 Astronomy Image Explorer. All Rights Reserved.
