

Image Details
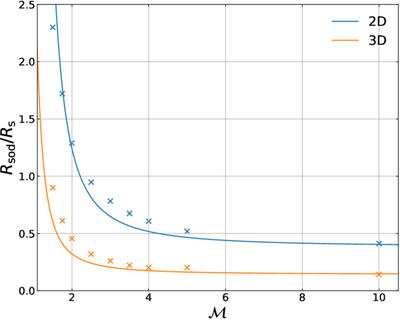
Caption: Figure 4.
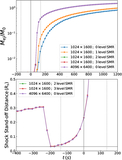
Shock stand-off distance Rsod as a function of the Mach number ﹩{ \mathcal M }﹩. The dots are measured from our simulation, while the solid lines are the best fit for the experimental results from F. S. Billig (1967). The blue and orange crosses represent results from 2D and 3D simulations, respectively. The blue and red lines are the best fit from the experiment for the cylinder wedge and spherical body (F. S. Billig 1967), respectively.
Other Images in This Article
Show More
Copyright and Terms & Conditions
© 2026. The Author(s). Published by the American Astronomical Society.

Copyright ©
2026 Astronomy Image Explorer. All Rights Reserved.
