

Image Details
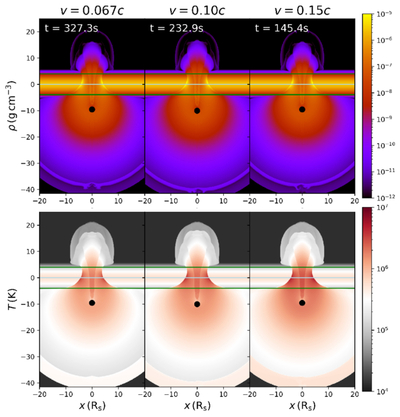
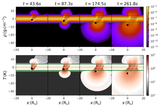
Caption: Figure 7.
Density and temperature snapshots for a star impact on the disk with different velocities from run03, 06, and 07. The top and bottom panels show the density and temperature, respectively. The left, middle, and right panels represent velocities of vs = 0.067c, 0.10c, and 0.15c, respectively. Each snapshot shows the moment when the star is at 9.6Rs from the disk’s midplane. The gray horizontal lines represent the disk’s midplane, and the green lines represent 4Hd from the midplane.
Other Images in This Article
Show More
Copyright and Terms & Conditions
© 2026. The Author(s). Published by the American Astronomical Society.

Copyright ©
2026 Astronomy Image Explorer. All Rights Reserved.
