

Image Details
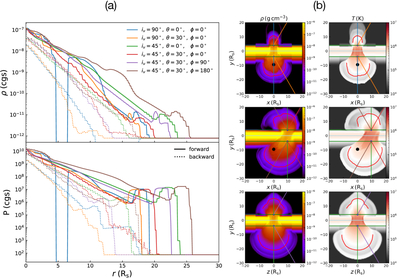
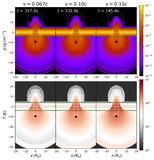
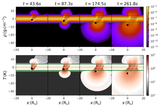
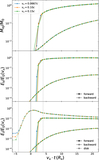
Caption: Figure 13.
(a) Density and pressure profiles as functions of the distance to the impact points at t = 327.2 s for run09 and 10. The top and bottom panels show the density and pressure profiles, respectively. The solid lines represent the forward ejecta profiles, while the dotted lines represent the backward ejecta profiles. Each color represents a different impact angle iv or ejection direction. (b) Density and temperature snapshots at t = 327.2 s. The first and second rows correspond to iv = 90° and 45° for z = 0 plane, respectively, while the third row corresponds to iv = 45° for a y–z plane crossing the impact points. The left and right columns show density and temperature, respectively. The gray horizontal lines represent the disk’s midplane, and the green lines represent 4Hd from the midplane. Straight lines from the impact points show the ejection directions used in (a). For iv = 90°, the blue and orange lines correspond to (θ, ϕ) = (0°, 0°) and (30°, 0°), respectively. For iv = 45°, the green, red, and brown lines correspond to (θ, ϕ) = (0°, 0°), (30°, 0°), and (30°, 180°), respectively. Colors match those in panel (a). The red semicircular lines correspond to the layer where τ = 2.
Other Images in This Article
Show More
Copyright and Terms & Conditions
© 2026. The Author(s). Published by the American Astronomical Society.

