

Image Details
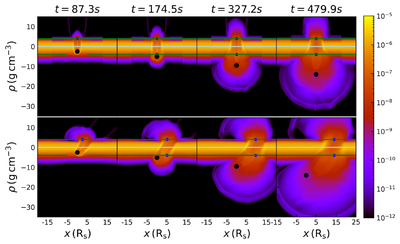
Caption: Figure 11.
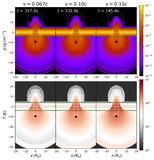
Density snapshots for z = 0 from 3D simulations (run09 and 10). The upper and lower rows are the results of the perpendicular (run09) and inclined (run10) impact, respectively. From left to right, each column corresponds to t = 87.3 s, 174.5 s, 327.2 s, and 479.9 s. The blue dots represent the impact points. The gray horizontal lines represent the disk’s midplane, and the green lines represent 4Hd from the midplane.
Other Images in This Article
Show More
Copyright and Terms & Conditions
© 2026. The Author(s). Published by the American Astronomical Society.

Copyright ©
2026 Astronomy Image Explorer. All Rights Reserved.
