Image Details
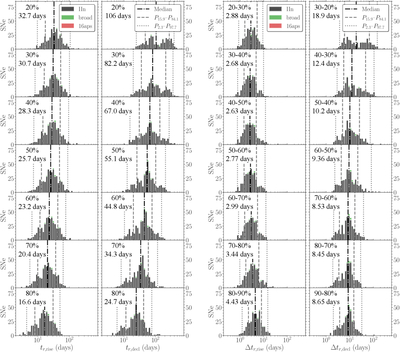
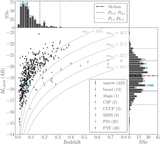
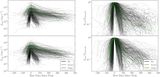
Caption: Figure 9.
Left: histograms of the r-band timescales (tr) above each 10% flux level relative to peak on the rise and decline. Right: the difference between successive 10% flux levels (Δtr, namely, the inverted slope) on the rise and decline. The vertical lines in each panel mark the median (with its value on the top left) and P15.9–P84.1 and P2.3–P97.7 ranges. For each distribution, the temporal progression along the light curve is counterclockwise from the left-top to right-top panels. The inverted slope is an increasing function, i.e., the light-curve slope becomes shallower with respect to time.
Other Images in This Article
Show More
Copyright and Terms & Conditions
© 2026. The Author(s). Published by the American Astronomical Society.
Copyright ©
2026 Astronomy Image Explorer. All Rights Reserved.