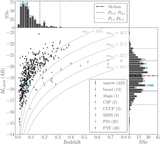
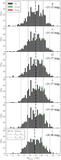
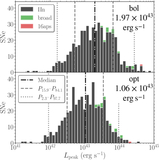
Image Details
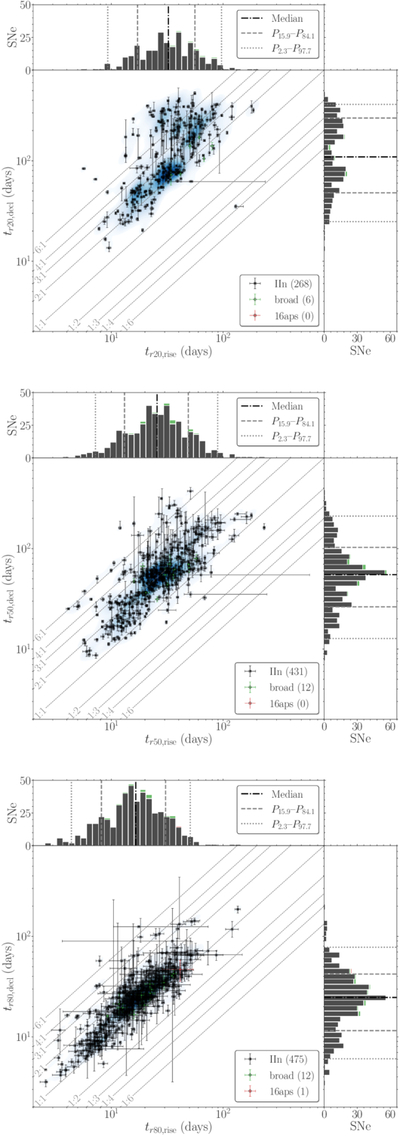
Caption: Figure 10.
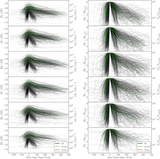
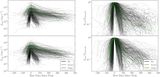
Comparisons of the r-band timescales on the rise and decline above three flux levels: 20% (tr20; top), 50% (tr50; middle), and 80% (tr80; bottom). The error bars denote 1σ uncertainties, while the underlying blue shaded regions represent the density maps. The light curves become more symmetric around the peak; tr20,decl ≈ 3 × tr20,rise, tr50,decl ≈ 2 × tr50,rise, and tr80,decl ≈ 1.5 × tr80,rise.
Other Images in This Article
Show More
Copyright and Terms & Conditions
© 2026. The Author(s). Published by the American Astronomical Society.
Copyright ©
2026 Astronomy Image Explorer. All Rights Reserved.