Image Details
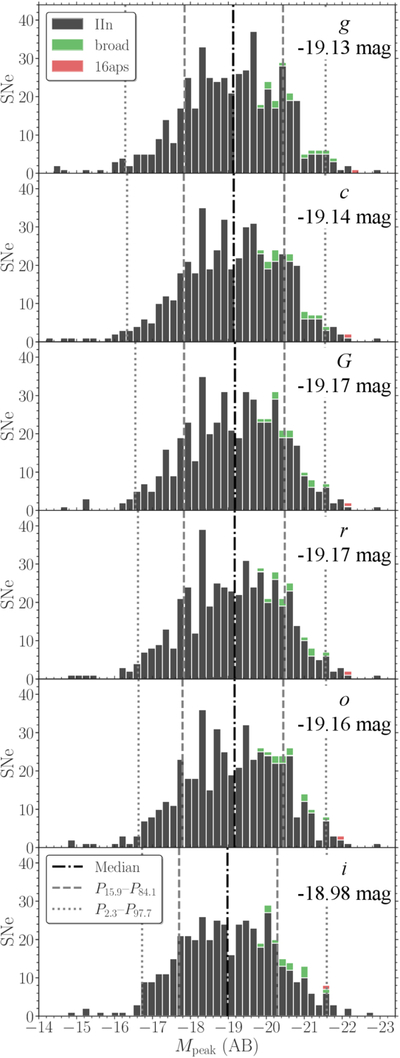
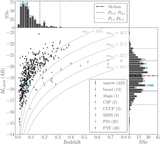
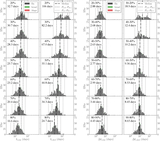
Caption: Figure 5.
Histograms of the peak absolute magnitude in each filter. “IIn” includes the entire sample (this work, CSP, CCCP, SDSS, PS1, and PTF), while “broad” and “16aps” are shown for comparison (as in Figure 4). The vertical lines in each panel mark the median (with its value on the top right) and P15.9–P84.1 and P2.3–P97.7 ranges. The peak distributions span ≈2.6 and ≈5.0 mag in all filters at the P15.9–P84.1 and P2.3–P97.7 ranges, respectively.
Other Images in This Article
Show More
Copyright and Terms & Conditions
© 2026. The Author(s). Published by the American Astronomical Society.
Copyright ©
2026 Astronomy Image Explorer. All Rights Reserved.