Image Details
Caption: Figure 2.
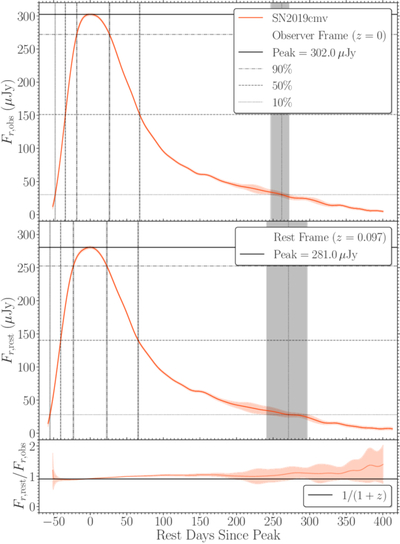
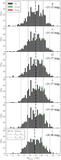
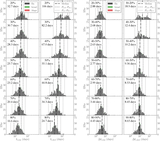
An example of the peak brightness and timescale measurements of the r-band GP light curves in the observer (top) and rest (middle) frames, along with the flux ratio in the two frames, i.e., the K-correction (bottom). The color-shaded region corresponds to the 1σ flux uncertainty in the GP light curve (Fν,err), which is propagated to the timescale uncertainty at each available 10% flux measurement with respect to the peak, i.e., the duration between Fν + Fν,err≤Fν,X%≤Fν − Fν,err on the rise or Fν − Fν,err≤Fν,X%≤Fν + Fν,err on the decline (gray shaded regions). The K-correction incorporates the SED information from the 2D GP (Figure 1) and differs from the cosmological-only correction of 1/(1 + z).
Other Images in This Article
Show More
Copyright and Terms & Conditions
© 2026. The Author(s). Published by the American Astronomical Society.