Image Details
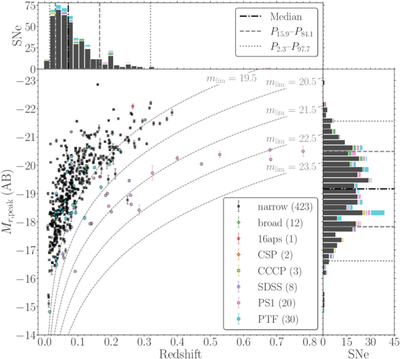
Caption: Figure 4.
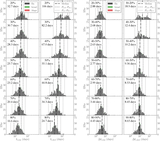
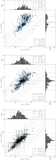
Peak r-band absolute magnitude vs. redshift, with projected histograms. The magnitude errors denote 1σ uncertainty. The dashed curves correspond to a range of survey limiting magnitudes. For presentation purposes, the sample is divided to “narrow-lined” SN IIn (this work), “broad-lined” SLSN-II (T. Kangas et al. 2022 and this work), the highly energetic SN IIn 2016aps (M. Nicholl et al. 2020), and literature SN IIn samples from previous surveys, analyzed uniformly here: CSP (M. Stritzinger et al. 2012; F. Taddia et al. 2013), CCCP (M. Kiewe et al. 2012), SDSS (M. Sako et al. 2018), PS1 (V. A. Villar et al. 2020), and PTF (A. Nyholm et al. 2020), with their sample size in the parentheses. The data used to create this figure is available in machine-readable format as the data behind the figure.
(The data used to create this figure are available in the online article.)
(The data used to create this figure are available.)
Other Images in This Article
Show More
Copyright and Terms & Conditions
© 2026. The Author(s). Published by the American Astronomical Society.