Image Details
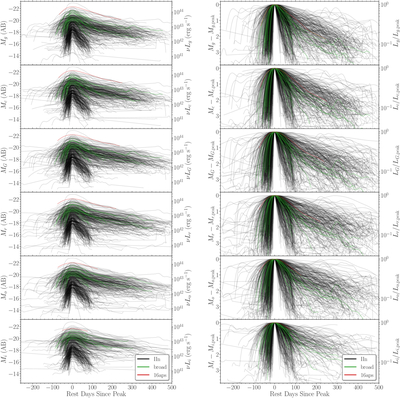
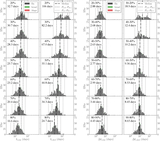
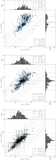
Caption: Figure 7.
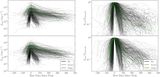
Left: GP light curves in absolute magnitude in each filter (g, c, G, r, o, and i from top to bottom) for the IIn sample (black) and comparison broad-lined (green) and SN 2016aps (red) events. Right: same light curves, but normalized at peak. While the IIn sample spans wide ranges of brightness and timescale, there are two clear light-curve morphologies: “faint–fast” and “luminous–slow” (see also Figure 18). The data used to create this figure is available in machine-readable format as the data behind the figure.
(The data used to create this figure are available in the online article.)
(The data used to create this figure are available.)
Other Images in This Article
Show More
Copyright and Terms & Conditions
© 2026. The Author(s). Published by the American Astronomical Society.