Image Details
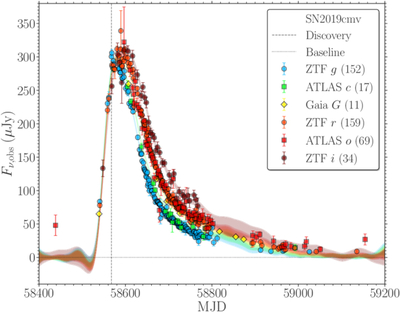
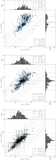
Caption: Figure 1.
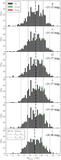
An example of the multiband observed (points) and 2D (time and frequency) GP light curves (lines and shaded regions). The error bars and shaded regions represent 1σ uncertainty in the observed and GP light curves, respectively. Only the ≥3σ detections (with the number in the parentheses for each band) are shown for clarity, but the nondetections are also used to anchor the GP light curves to zero flux (i.e., baseline) before and after the SN.
Other Images in This Article
Show More
Copyright and Terms & Conditions
© 2026. The Author(s). Published by the American Astronomical Society.
Copyright ©
2026 Astronomy Image Explorer. All Rights Reserved.