Image Details
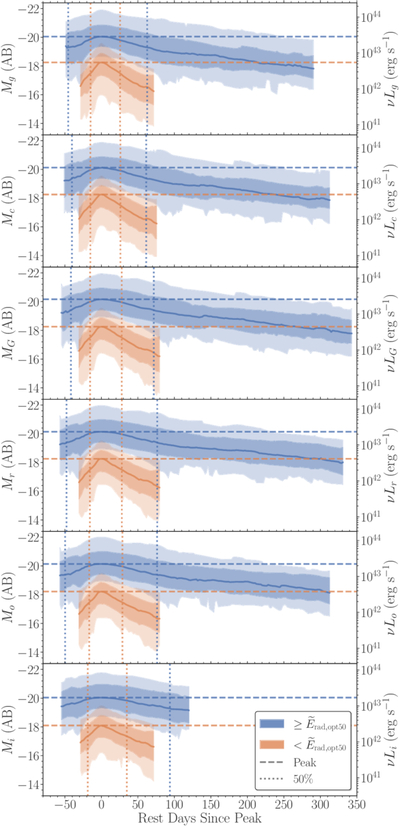
Caption: Figure 18.
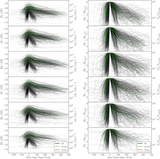
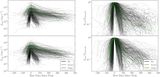
Median light curves in each filter separated by the median optical radiated energy, ﹩{\widetilde{E}}_{{\rm{rad}},{\rm{opt}}50}﹩ (g, c, G, r, o, and i from top to bottom). The peak and 50% measurements are marked by the horizontal dashed and vertical dotted lines, respectively. The shaded regions with different transparency represent P15.9–P84.1 and P2.3–P97.7 ranges. The two main groups of SNe IIn (faint–fast and luminous–slow) are clear, with their templates overlapping only at the P2.3–P97.7 level. The data used to create this figure is available in machine-readable format as the data behind the figure.
(The data used to create this figure are available in the online article.)
(The data used to create this figure are available.)
Other Images in This Article
Show More
Copyright and Terms & Conditions
© 2026. The Author(s). Published by the American Astronomical Society.