Image Details
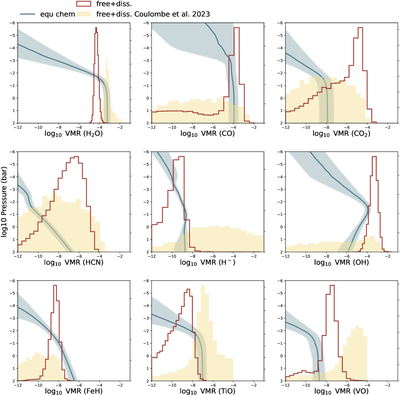
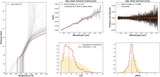
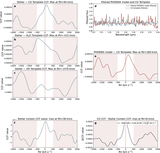
Caption: Figure 12.
Posterior distributions of the VMRs for key atmospheric species in WASP-18 b. The blue lines and shaded regions represent the median VMR profiles and their 1σ uncertainties derived from our equilibrium chemistry retrieval. The red histograms show the posterior distributions of the deep abundances retrieved from our free chemistry with thermal dissociation (free + dissociation) retrieval. For comparison, the yellow-filled histograms display the corresponding results from the free + dissociation retrieval of L.-P. Coulombe et al. (2023).
Other Images in This Article
Show More
Copyright and Terms & Conditions
© 2026. The Author(s). Published by the American Astronomical Society.
Copyright ©
2026 Astronomy Image Explorer. All Rights Reserved.