Image Details
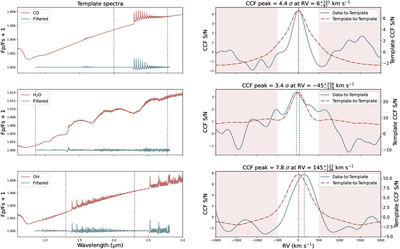
Caption: Figure 2.
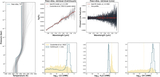
Cross-correlation detections from the WASP-18 b DES. Left panel: the template spectra and the Gaussian-filtered spectra for CO, H2O, and OH (top to bottom), generated using the methods described in Section 3. The vertical dashed lines indicate the wavelength ranges used for the cross-correlation analysis: 2.0–2.78 μm for CO, 0.86–2.78 μm for H2O, and 1.30–2.30 μm for OH. Right panel: the data-to-template and template-to-template CCF S/Ns for each species, derived from correlating the master planetary residual spectrum with the respective template. The vertical dashed lines mark the RV of the peak signal. The light red shaded areas represent the RV ranges, [−2000, −500] km s−1 and [500, 2000] km s−1, used for noise estimation.
Other Images in This Article

Show More
Copyright and Terms & Conditions
© 2026. The Author(s). Published by the American Astronomical Society.