Image Details
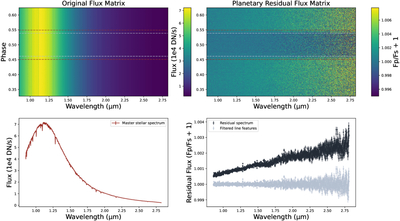
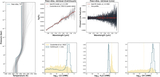
Caption: Figure 1.
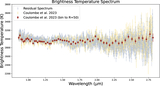
The planetary direct spectrum extraction steps. Top left: the original stellar spectral matrix. The red dashed lines indicate T1 and T4, while the white dashed lines mark T2 and T3. Bottom left: the master stellar spectrum, derived by averaging all spectra within the eclipse phase (T23). Top right: the planetary residual flux matrix, obtained by dividing the original flux matrix by the master stellar spectrum. Bottom right: the final WASP-18 b direct-extracted spectrum (DES; black) and the Gaussian-filtered spectrum (light blue).
Other Images in This Article

Show More
Copyright and Terms & Conditions
© 2026. The Author(s). Published by the American Astronomical Society.
Copyright ©
2026 Astronomy Image Explorer. All Rights Reserved.