Image Details
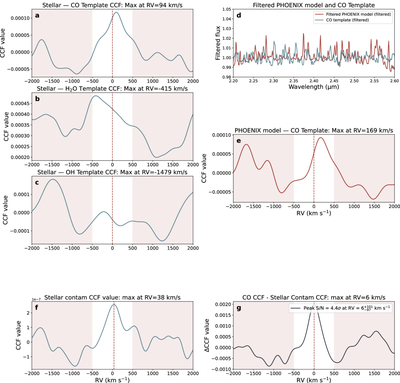
Caption: Figure 8.
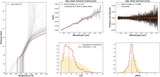
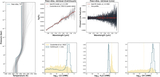
Subplots a, b, and c: CCFs of the in-eclipse stellar spectrum of WASP-18 against the three molecular templates (CO, H2O, and OH). The red vertical dashed lines denote RV = 0 km s−1. d: a direct comparison between the WASP-18 PHOENIX spectrum absorption lines and the CO template emission lines in 2.2–2.6 μm. Both spectra have been scaled to facilitate visual comparison. e: the CCF of the WASP-18 PHOENIX spectrum and the CO template, which exhibits a profile similar to the observed stellar CCF shown in the top left panel. f and g: similar to Figure 2, but showing the stellar contamination CCF values (f) and the planetary CO CCF subtract stellar contamination CCF value and S/N (g).
Other Images in This Article

Show More
Copyright and Terms & Conditions
© 2026. The Author(s). Published by the American Astronomical Society.