Image Details
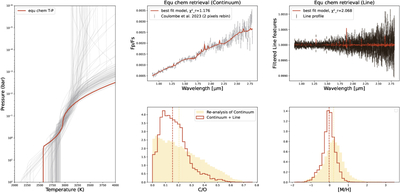
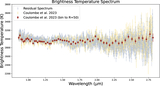
Caption: Figure 4.
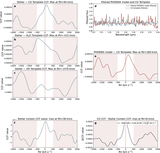
Results of the chemical equilibrium retrieval. Left panel: the retrieved T–P profile. Top middle and right panels: the continuum and line profile spectra with the best-fit chemical equilibrium model, respectively. Bottom middle and right panels: comparison of the C/O and [M/H] posteriors from our joint retrieval and continuum-only retrieval.
Other Images in This Article

Show More
Copyright and Terms & Conditions
© 2026. The Author(s). Published by the American Astronomical Society.
Copyright ©
2026 Astronomy Image Explorer. All Rights Reserved.