Image Details
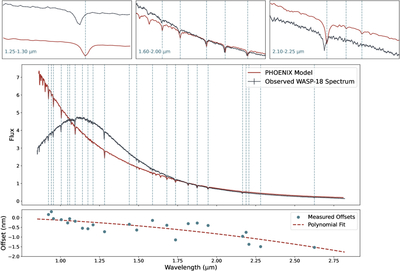
Caption: Figure 6.
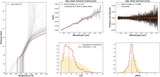
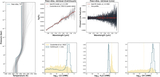
Top panels: comparison of the observed WASP-18 spectrum processed by exoTEDRF and PHOENIX model spectrum. To compare the stellar absorption lines, both spectra have been scaled in the plot. The vertical dashed lines indicate the precise wavelengths of the stellar lines used for our wavelength optimization. The three inset panels provide zoomed-in views of the 1.20–1.30, 1.60–2.00, and 2.10–2.25 μm regions, respectively. A significant offset is clearly visible between the wavelength solution of the observed spectrum and the model. Bottom panels: the offsets between the PHOENIX wavelength solution and exoTEDRF pipeline wavelength solution, and the polynomial fitting of these offsets.
Other Images in This Article

Show More
Copyright and Terms & Conditions
© 2026. The Author(s). Published by the American Astronomical Society.