Image Details
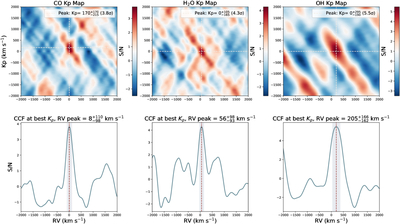
Caption: Figure 3.
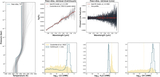
Left panel: Kp map for the CO signal of WASP-18 b (top) and the corresponding CCF at the maximum S/N (bottom). The crossing of the dashed white lines indicates the location of the maximum S/N. In the bottom plot, the vertical dashed line and shaded region mark the RV peak and its 1σ confidence interval, respectively. Middle and right panels: same as the left panel, but for H2O and OH, respectively.
Other Images in This Article

Show More
Copyright and Terms & Conditions
© 2026. The Author(s). Published by the American Astronomical Society.
Copyright ©
2026 Astronomy Image Explorer. All Rights Reserved.