Image Details
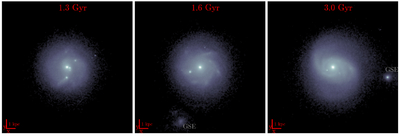
Caption: Figure 2.
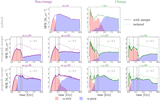
Face-on view of the stellar density distribution in model c.r.c03. Time increases from left to right and is measured since the start of the simulation at t = 0 Gyr. The clumpy features are visible early in the evolution of the main galaxy and last up to approximately 3 Gyr. At 1.6 and 3.0 Gyr, the GSE-like dwarf is at its first and nearing its last pericenter, respectively.
Other Images in This Article
Copyright and Terms & Conditions
© 2026. The Author(s). Published by the American Astronomical Society.
Copyright ©
2026 Astronomy Image Explorer. All Rights Reserved.