Image Details
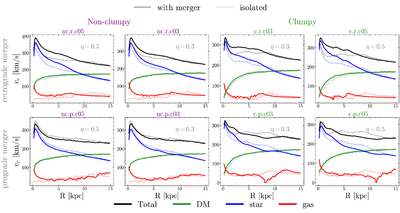
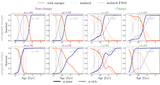
Caption: Figure A1.
The rotation curve of the models used in this work. The dark matter, star, gas, and total mass contribution are shown in green, blue, red, and black solid lines. The dotted lines correspond to the isolated clumpy/nonclumpy model counterparts.
Other Images in This Article
Copyright and Terms & Conditions
© 2026. The Author(s). Published by the American Astronomical Society.
Copyright ©
2026 Astronomy Image Explorer. All Rights Reserved.