Image Details
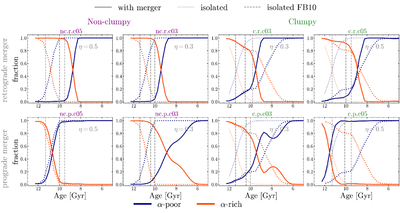
Caption: Figure 6.
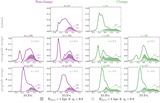
Present day chemical disks' mass fraction per age bin. We use the previous definition of α-poor (blue) and α-rich (orange) populations to calculate their fraction contribution in each age bin. Colored dotted and dashed lines show the corresponding clumpy or nonclumpy isolated model counterpart. The time of the pericenter passage is indicated by the vertical gray dashed lines.
Other Images in This Article
Copyright and Terms & Conditions
© 2026. The Author(s). Published by the American Astronomical Society.
Copyright ©
2026 Astronomy Image Explorer. All Rights Reserved.