Image Details
Caption: Figure 4.
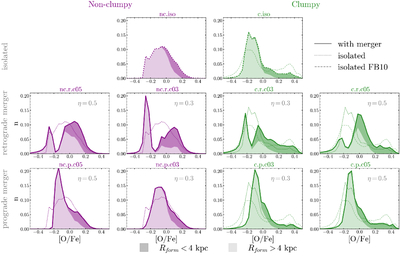
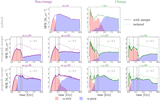
[O/Fe] histogram for the interval −0.7 < [Fe/H] < −0.2, 4 < R/kpc < 12, and ∣z∣ < 3 kpc. All models share the same initial gas and dark matter distribution for the MW-like and dwarf galaxies. Clumpy and nonclumpy models are distinguished by titles colored in green and purple, respectively. Retrograde and prograde models are shown in the second and third rows, respectively. The satellite’s initial orbital circularity is set to 0.3 (second and third columns) or 0.5 (first and fourth columns). Dotted lines correspond to the isolated control models shown in the top row. We also include an isolated model with a stronger clumpy phase (“isolated FB10”) shown as the dashed line. While all the retrograde merger models can produce a double-peak distribution in [O/Fe], the nonclumpy models with a prograde merger have a similar unimodal distribution compared to their isolated counterpart. Moreover, the clumpy+prograde merger has a smaller fraction of α-rich stars, compared to the clumpy isolated model. The initial orbital circularity of the satellite, η, is indicated in each panel. The dark (light) shaded area corresponds to the contribution of stars born in the inner (outer) parts of the galaxy, i.e., R < 4 kpc (R > 4 kpc).
Other Images in This Article
Copyright and Terms & Conditions
© 2026. The Author(s). Published by the American Astronomical Society.