Image Details
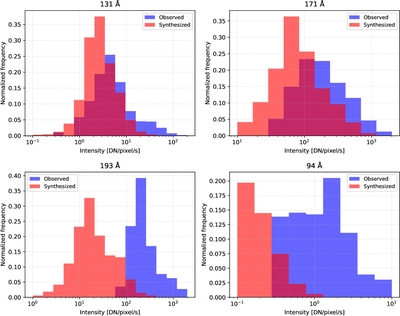
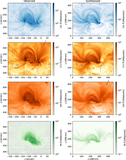
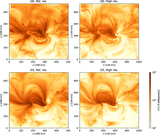
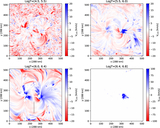
Caption: Figure 5.
Histograms of the observed and synthesized intensities in four AIA channels, which are shown in Figure 4. For each channel, the histogram is calculated for the logarithmic intensity and normalized to the numbers of pixels/grid points in the observed/synthesized images. Note that the model-synthesized intensity may contain arbitrarily small numbers. A lower bound is applied to each channel as indicated by the axis.
Other Images in This Article
Show More
Copyright and Terms & Conditions
© 2026. The Author(s). Published by the American Astronomical Society.
Copyright ©
2026 Astronomy Image Explorer. All Rights Reserved.