Image Details
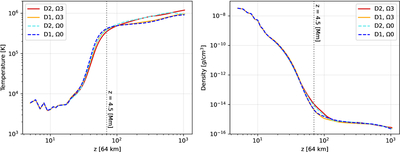
Caption: Figure 7.
Coronal density and temperature as a function of height. The results from four run cases, as indicated by the legend, are compared. The data are averaged over time for a period of more than 1 hr. The 3D cube is averaged in the horizontal dimensions, which provides the height profile shown here. The axis of height is displayed on a logarithmic scale, such that the lower atmosphere of a stronger stratification is stretched, whereas the coronal part with a much larger scale height is compressed. The vertical dashed line is placed at 70 grid points (4.48 Mm) above the bottom boundary and indicates the bottom of the corona or say the top of the transition region.
Other Images in This Article
Show More
Copyright and Terms & Conditions
© 2026. The Author(s). Published by the American Astronomical Society.