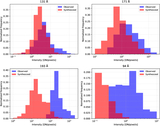
Image Details
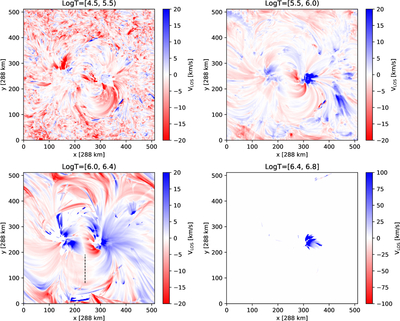
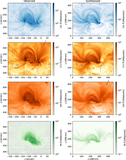
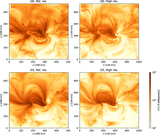
Caption: Figure 10.
Line-of-sight velocities of the plasma in different temperature ranges. The emission-measure-weighted mean velocity in the display temperature range is obtained following Equation (6) and is equivalent to the Doppler velocity that would be measured from a spectral line forming in the given temperature range. Positive values (shown in blue) correspond to upflows. The vertical dashed line indicates the slit position for the time–distance diagram shown in Figure 12.
Other Images in This Article
Show More
Copyright and Terms & Conditions
© 2026. The Author(s). Published by the American Astronomical Society.
Copyright ©
2026 Astronomy Image Explorer. All Rights Reserved.