Image Details
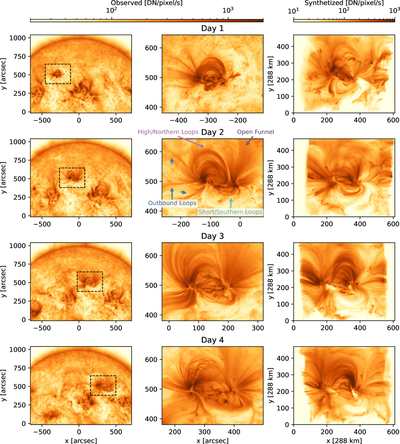
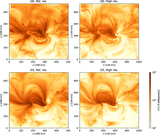
Caption: Figure 3.
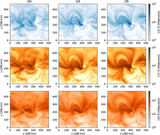
Comparison of the observed (left and middle columns) and synthesized (right column) AIA 171 Å images of AR 11640 over 4 days (each row). The actual AIA 171 Å images captured at 2:00 UT are displayed on a logarithmic scale between 20 and 2000 DN pixel–1 s–1. The black boxes in the left column indicate the field of view of the images in the middle column. The colored arrows indicate key coronal features for comparison in the rest of the study. The synthesized 171 Å images from the radiative MHD models with Ω = 0 (see the main text for details) are shown on a logarithmic scale between 10 and 1000 DN pixel–1 s–1, which is lower than that of the observed images. The angles of view of the synthesized images are chosen according to the locations of the actual active region on the solar disk on the corresponding days.
Other Images in This Article
Show More
Copyright and Terms & Conditions
© 2026. The Author(s). Published by the American Astronomical Society.