Image Details
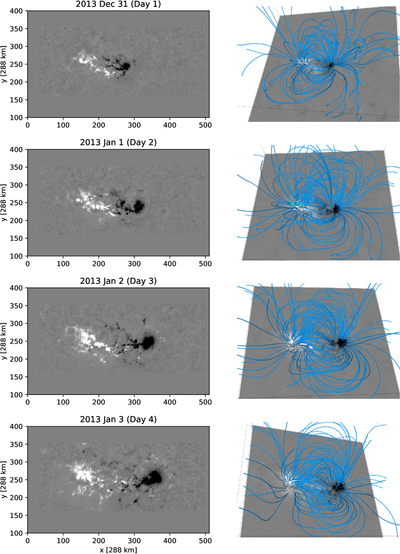
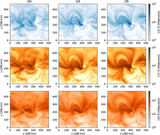
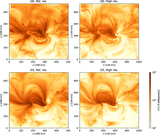
Caption: Figure 2.
The left column shows the evolution of the observed radial magnetic field of AR 11640. Only the central part of the padded array is displayed. The right column presents the coronal magnetic field in the Bevo_Ω0 run. The angle of view in each panel is set to reflect the position of the active region on the solar disk at the observed time. The grayscale images show Bz at the bottom of the simulation domain. Magnetic field lines are calculated from static seed points that are uniformly distributed in the central part of the domain.
Other Images in This Article
Show More
Copyright and Terms & Conditions
© 2026. The Author(s). Published by the American Astronomical Society.
Copyright ©
2026 Astronomy Image Explorer. All Rights Reserved.