Image Details
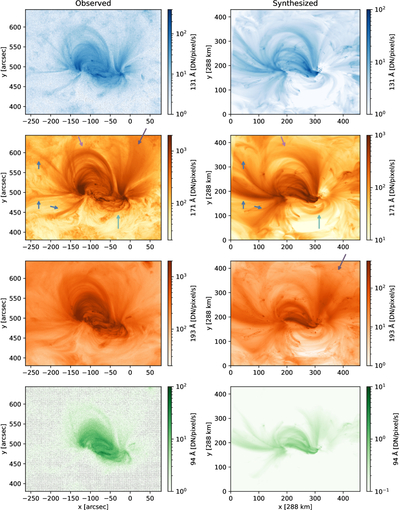
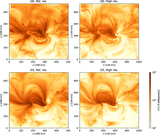
Caption: Figure 4.
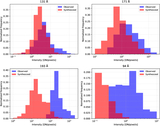
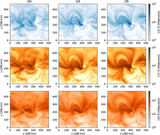
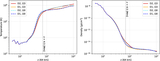
Comparison of the observed and synthesized AIA images in four passbands. The actual AIA 131, 171, 193, and 94 Å images captured on Day 2 at 02:00 UT are displayed in the left column. The synthesized images of the corresponding channels from the D2_Ω3 radiative MHD models are shown in the right column. The angle of view of the synthesized images is chosen according to the locations of the actual active region on the solar disk on Day 2. The arrows are identical to those shown in Figure 3 and indicate key features for comparison. Note that the dynamic ranges of the images are chosen to achieve a visual similarity. A quantitative comparison of the count rates is presented in Figure 5.
Other Images in This Article
Show More
Copyright and Terms & Conditions
© 2026. The Author(s). Published by the American Astronomical Society.