Image Details
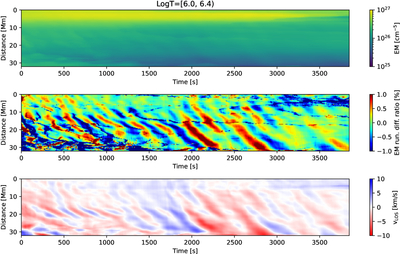
Caption: Figure 12.
Time–distance diagram illustrating the propagating disturbances along the slit shown in Figure 10. The top panel displays the emission measure (EM) summed over the temperature between 106.0 and 106.4 K. The middle panel shows the running difference ratio of the EM, which is the difference in the slit intensity at two consecutive times divided by that of the former. The bottom panel shows the Doppler velocity in the same temperature range, as shown in Figure 10.
Other Images in This Article
Show More
Copyright and Terms & Conditions
© 2026. The Author(s). Published by the American Astronomical Society.
Copyright ©
2026 Astronomy Image Explorer. All Rights Reserved.