Image Details
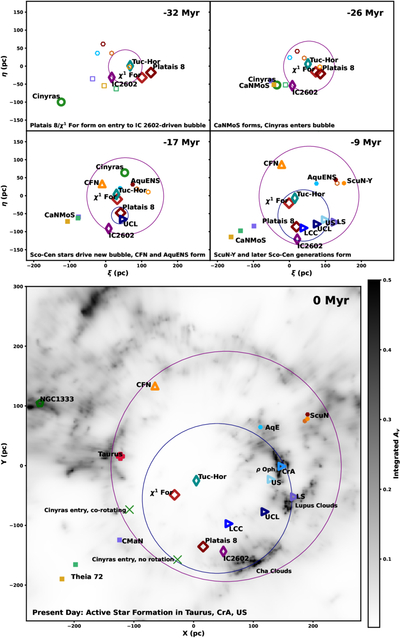
Caption: Figure 7.
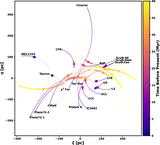
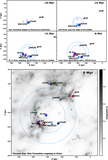
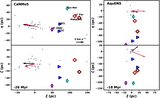
Trace back of young associations connected to the Local Family. In all panels, literature populations are shown as larger markers, and low-mass associations use smaller markers that are open before formation and filled after formation. Circles indicate the edges of our Local Bubble models, with the outer model driven by IC 2602 in purple, and the inner model driven by early generations in Sco–Cen in blue. In the bottom panel, we show all features in the present day overlaid on the G. Edenhofer et al. (2024) dust map. The edges of the Local Bubble align closely with our models, with the inner model following clouds associated with Sco–Cen (labeled), and the outer model following Taurus and several other lower-density structures. We also mark the entry point of RSG 5 in Cinyras into the outer bubble model, which aligns closely with the center of the Mirzam Tunnel when assuming no bubble rotation rather than rotation with the Galaxy. The online-only version can be interacted with in 3D by zooming, rotating, and panning. We also provide buttons to toggle the display of the dust, populations, and bubble models. Mousing over data points provides positions and population names.
An interactive version of this figure is available in the online article.
An interactive version of this figure is available.
An interactive version of this figure is available in the online journal.
Other Images in This Article
Copyright and Terms & Conditions
© 2026. The Author(s). Published by the American Astronomical Society.