Image Details
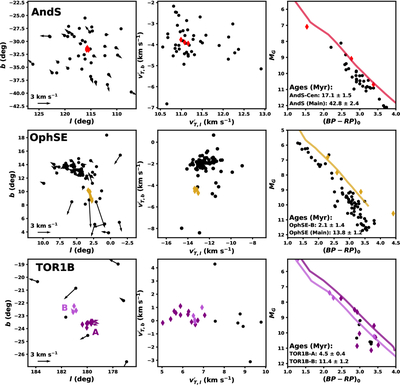
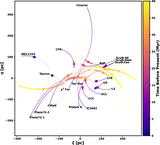
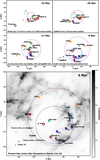
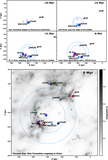
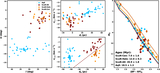
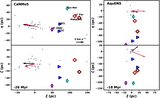
Caption: Figure 10.
Substructures in AndS, OphSE, and TOR1B, with the association annotated by row. Stars outside the substructures are shown with black circles, and the dynamically and temporally distinct subcomponents are marked with colored diamonds. The left column shows the on-sky spatial distribution in l vs. b coordinates, with arrows that indicate a virtual expansion-corrected transverse velocity relative to the population’s average, and the middle column shows l vs. b transverse velocity. The right column shows a CMD for each population, revealing that all substructures have distinct ages, especially OphSE-B in OphSE and AndS–Cen in AndS. Their ages are annotated, and the best-fit isochrones are shown with colors matching the markers.
Other Images in This Article
Copyright and Terms & Conditions
© 2026. The Author(s). Published by the American Astronomical Society.