Image Details
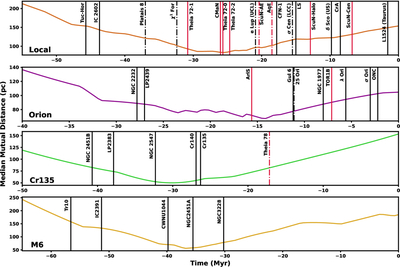
Caption: Figure 3.
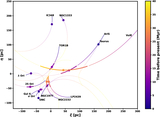
Formation and trace back histories for the Local and Orion Families, which we associate with the Local and Orion–Eridanus Bubbles, in addition to the Cr135 and M6 Families from C. Swiggum et al. (2024). The colored curves show the median mutual distance between members of the family, with the minimum indicating a potential start time for expansion. The times of formation for literature populations (black) and low-mass associations (red) in each family are marked with vertical lines. Solid lines indicate populations we relate to the early expansion of a feedback-driven bubble or star formation in the bubble itself, indicated by outbound velocities and a position consistent with a presumed bubble edge. Populations consistent with triggering through a collision with a bubble but not bubble membership are marked with broken vertical lines, indicated by a formation site near a presumed bubble edge, but without outward-oriented velocities.
Other Images in This Article
Copyright and Terms & Conditions
© 2026. The Author(s). Published by the American Astronomical Society.