

Image Details
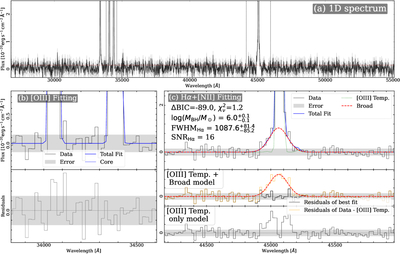
Caption: Figure A1.
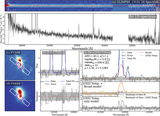
Illustration of our mock spectrum. Panel (a) displays the mock spectrum of the. In this case, the continuum is hard to detect. Panel (b) presents the fit to the [O III] emission line doublet. The mock spectrum and the uncertainty are shown as a black histogram and a gray-shaded region. The best-fit model is shown as a blue line. Panel (c) shows the fit to the Hα+[N II] emission complex. Similar to Figure B1, the top subpanel displays the data (black histogram), the total best-fit model (blue line), the broad Hα component (red-dashed line), and the narrow-line template derived from the [O III] profile (green dotted line). The lower two subpanels show the fit residuals. The middle subpanel confirms the quality of the total fit, while the bottom subpanel demonstrates that a model lacking the broad Hα component provides a significantly poorer fit to the data. This mock observation was generated for a BH with a mass of ﹩\mathrm{log}{M}_{{\rm{BH}}}/{M}_{\odot }=5.99﹩ and a magnification of μ = 3.0, located at a redshift of z = 5.8656.
Other Images in This Article
Show More
Copyright and Terms & Conditions
© 2026. The Author(s). Published by the American Astronomical Society.

