

Image Details
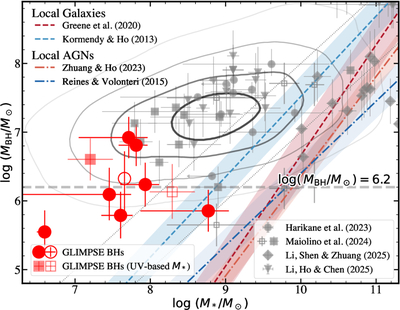
Caption: Figure 6.
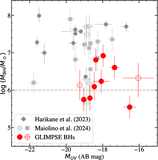
Relation between BH mass and galaxies’ stellar mass for our sources. Our sources are shown as red circles and squares, where circles denote sources whose M* were derived from SED fitting, and squares denote those M* estimated based on UV magnitude. Filled circles indicate objects with robust broad Hα line detections, whereas open circles denote sources with more marginal detections. The gray transparent circles, squares, diamonds, and triangles depict the stellar mass and BH from the literature for high-z AGNs (Y. Harikane et al. 2023; R. Maiolino et al. 2024a; J. Li et al. 2025a; R. Li et al. 2026). The light-blue and dark-red-dashed lines represent the MBH–M* relationship in the local Universe for inactive galaxies (J. Kormendy & L. C. Ho 2013; J. E. Greene et al. 2020), the dark-blue and orange dashed–dotted lines represent the relationship for local AGN host galaxies (A. E. Reines & M. Volonteri 2015; M.-Y. Zhuang & L. C. Ho 2023), respectively. The black dotted lines denote constant MBH/M* of 0.1% and 1%. The gray contour represents the selection bias inherent to the MBH–M* relation, adapted from the result from J. Li et al. (2025b).
Other Images in This Article
Show More
Copyright and Terms & Conditions
© 2026. The Author(s). Published by the American Astronomical Society.

