

Image Details
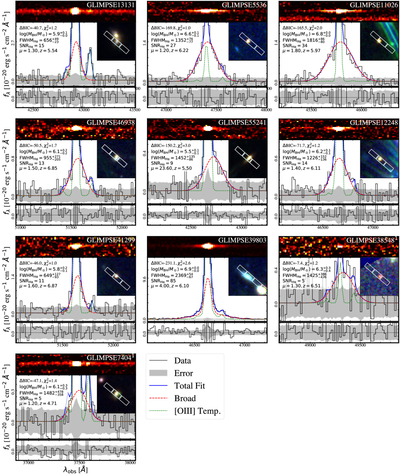
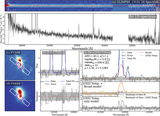
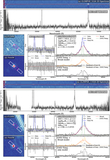
Caption: Figure 2.
The spectra of our broad-line AGN and the best-fit result. For each source, the top panel displays the two-dimensional spectrum. The middle panel presents the corresponding one-dimensional spectrum, obtained through optimal extraction (black histogram). The uncertainty is represented by the gray-shaded region. Overplotted on the 1D spectrum is the best-fit model (blue solid line), which is decomposed into narrow components from the [O III] line template (green dotted line) and the broad Hα emission (red-dashed line). The bottom panel presents the residual. The inset image presented in the middle panel shows the red, green, blue image generated with JWST/NIRCam F150W, F277W, and F444W filters, and the corresponding NIRSpec/G395M shutters. The final two subpanels are dedicated to presenting the spectra and corresponding model fits for two tentative detections, ID 38548 and ID 7404. Basic fitting parameters and properties of sources are listed in the middle panel. ΔBIC shows the difference between the BIC for the best-fit model and the narrow-only model, and ﹩{\chi }_{\nu }^{2}﹩ is the reduced chi-squared value corresponding to the best-fit model. ﹩\mathrm{log}({M}_{{\rm{BH}}}/{M}_{\odot })﹩ is the BH mass, estimated from the properties of the broad Hα emission. FWHMHα and SNRHα represent the FWHM and the SNR of the broad Hα emission. μ is the gravitational lensing magnification factor for the source, and z is the redshift.
Other Images in This Article
Show More
Copyright and Terms & Conditions
© 2026. The Author(s). Published by the American Astronomical Society.

