

Image Details
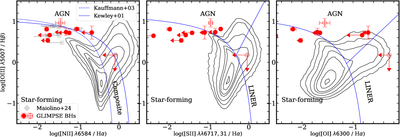
Caption: Figure 5.
BPT diagrams of our targets. The distribution of local galaxies from the Sloan Digital Sky Survey DR7 is shown as background contours, illustrating the star-forming sequence and AGN branch. Demarcation lines from L. J. Kewley et al. (2001) (solid blue) and G. Kauffmann et al. (2003) (dashed blue) separate star-forming galaxies from AGNs in the left panel. In the right panels, these lines distinguish between star-forming galaxies, AGNs, and LINERs. Our sources are plotted as red circles, plotted with other JWST-discovered faint AGNs from R. Maiolino et al. (2024a) (gray squares).
Other Images in This Article
Show More
Copyright and Terms & Conditions
© 2026. The Author(s). Published by the American Astronomical Society.

Copyright ©
2026 Astronomy Image Explorer. All Rights Reserved.
