

Image Details
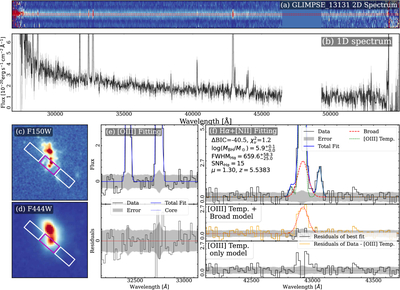
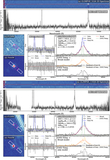
Caption: Figure B1.
Panel (a) displays the 2D NIRSpec spectrum, while panel (b) shows the corresponding 1D spectrum, extracted from the spatial region indicated by the red lines in the upper panel. Panels (c) and (d) present JWST/NIRCam image cutouts of the source in the F150W and F444W filters, respectively. The spectroscopic observation was conducted using a three-shutter slit with a three-point nodding pattern; the central shutter targeting the source is highlighted in magenta, and the adjacent shutters used for background subtraction are outlined in white. Panel (e) presents a multicomponent fit to the [O III] emission line doublet. The observed data and its associated uncertainty are shown as a black histogram and a gray-shaded region. The best-fit model (blue line) is composed of a narrow ’core’ component (blue dotted line) and a broader, outflow component (green dotted line; the outflow component is not necessary for this source). Panel (f) shows the fit to the Hα+[N II] emission complex. The top subpanel displays the data (black histogram), the total best-fit model (blue dashed line), the broad Hα component, and the narrow-line template based on the [O III] profile. The lower two subpanels show the fit residuals (data minus model). The middle subpanel confirms the quality of the total fit, while the bottom subpanel demonstrates that a model lacking the broad Hα component provides a significantly poorer fit to the data, thereby confirming the AGN detection.
Other Images in This Article
Show More
Copyright and Terms & Conditions
© 2026. The Author(s). Published by the American Astronomical Society.

